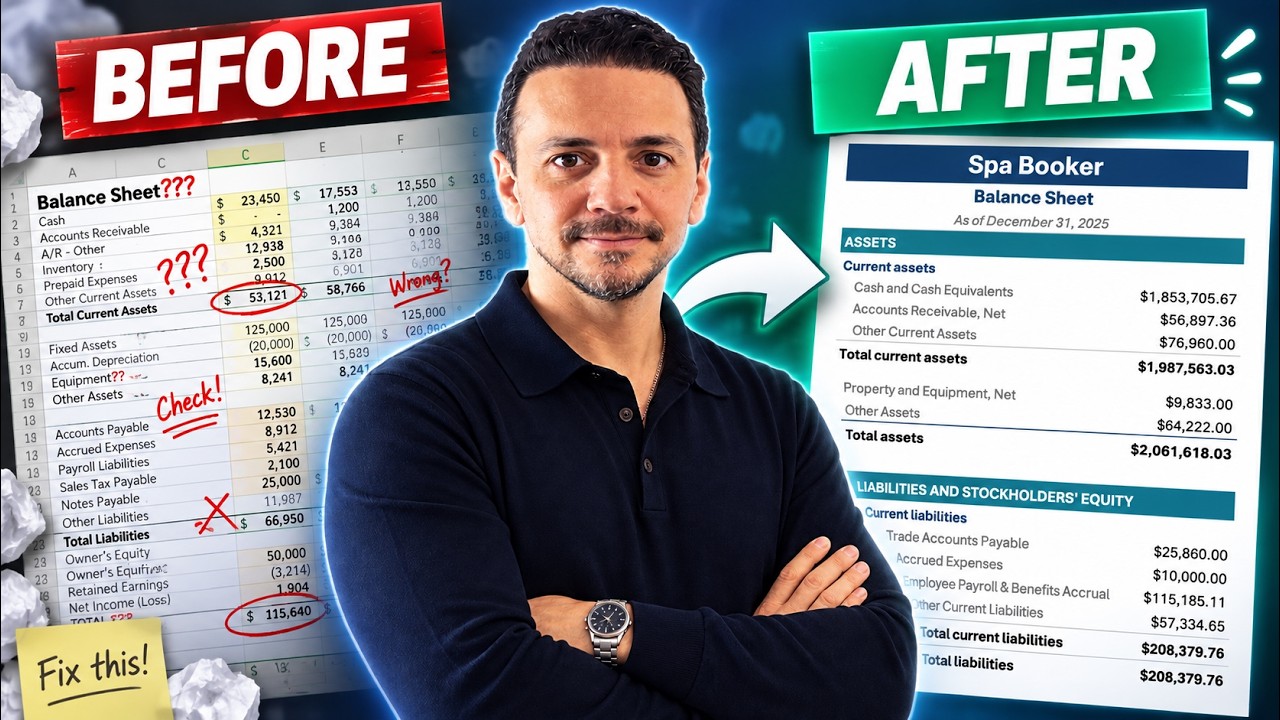
If you pull a balance sheet directly from an accounting system, there is a good chance it will not look like something you would want to hand to an auditor, investor, lender, or senior executive. You may have dozens—or even hundreds—of individual general ledger accounts showing up as separate rows. Technically, the balance sheet may balance. But that does not mean it is presented well.
The goal is not to change the accounting. The goal is to organize the accounting information into a financial statement that somebody can actually understand. Here is a practical four-step process I use to turn a messy balance sheet into a cleaner, more audit-ready report.
Why Accounting-System Balance Sheets Get Messy
Your accounting system and your financial statements serve two different purposes. Your general ledger needs detail. For example, you might have an operating checking account, payroll checking account, savings account, and money market account. That detail is useful when recording transactions and reconciling accounts.
But your external balance sheet probably does not need four separate cash lines. It may simply need Cash and cash equivalents. The same thing happens throughout the chart of accounts. The mistake is assuming that every general ledger account deserves its own line on the financial statement. It usually does not.
Step 1: Preserve the Original Balance Sheet
The first thing I would do is preserve the original report exactly as it came from the accounting system. Do not immediately start deleting rows, combining accounts, and changing account names inside the source report.
In Excel, I like maintaining three separate tabs:
- Original Balance Sheet
- Mapping
- Final Balance Sheet
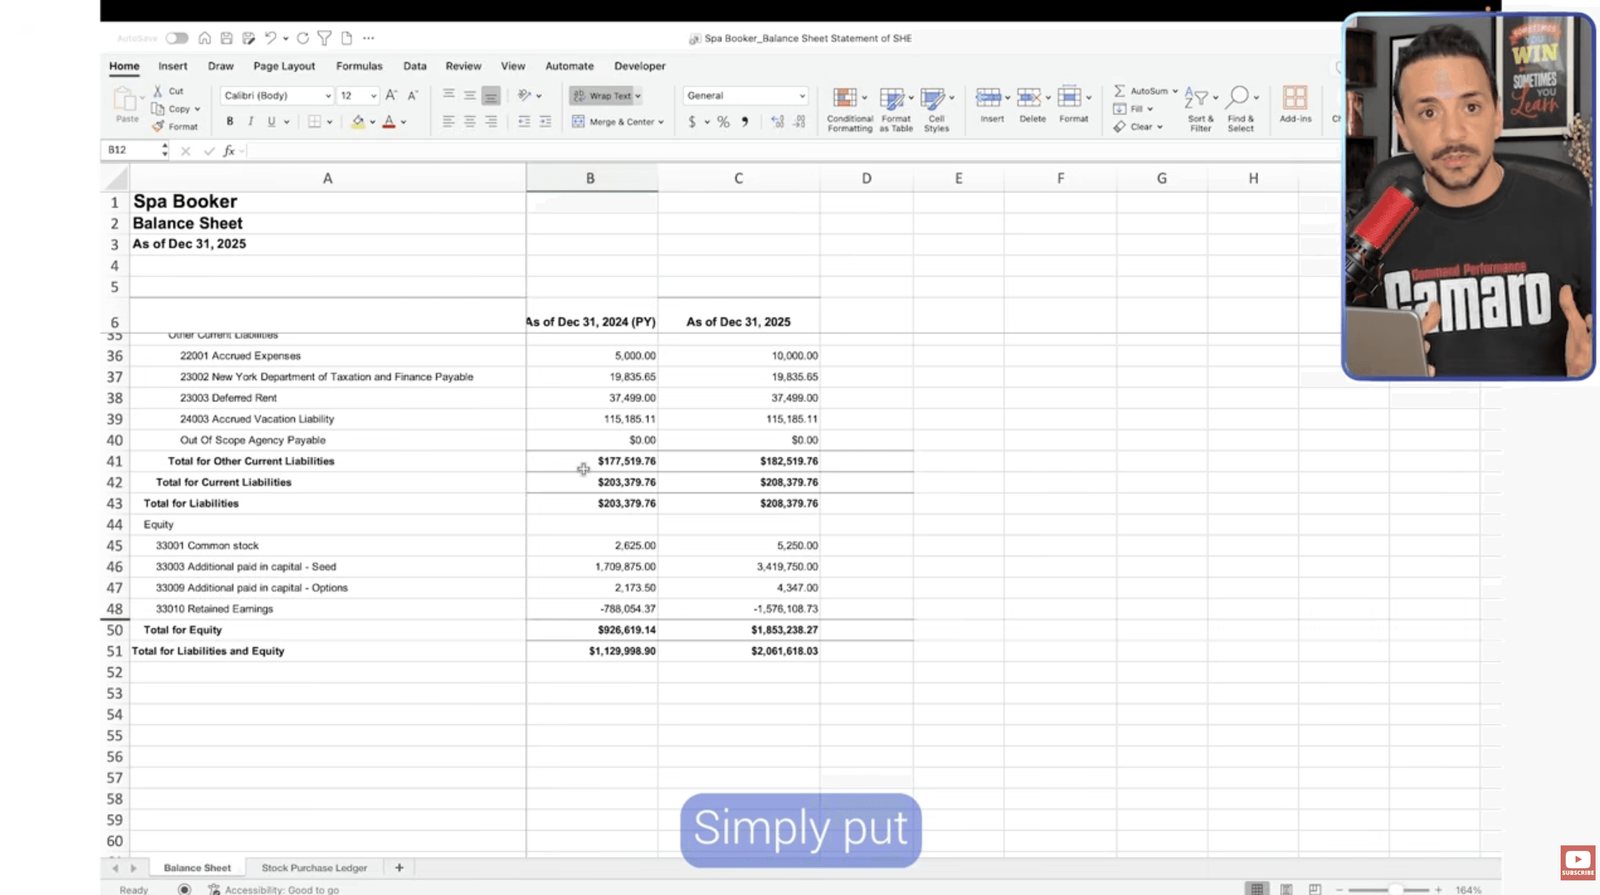
The Original Balance Sheet becomes your source. If somebody later asks where a number came from, you should be able to trace the amount from the final financial statement back through the mapping and ultimately to the original general ledger account. That traceability is much better than manually editing a report until it looks pretty and then having no idea how you got there.
Step 2: Create an Account Mapping
The Mapping tab is where most of the work happens. For every account on the original balance sheet, decide where you want that account to appear on the final financial statement.
Suppose your accounting system contains Chase Operating Account, Chase Payroll Account, Business Savings, and a Money Market Account. Instead of presenting all four accounts individually, you might map all four to Cash and cash equivalents. The underlying accounts still exist. You are simply creating a reporting layer on top of them.
This is one of the most useful concepts to understand when preparing financial statements: your chart of accounts does not have to look exactly like your financial statements. The chart of accounts can remain detailed for operational accounting purposes while the financial statements summarize those accounts into cleaner reporting categories.
Example Balance Sheet Mapping
For assets, your final categories might include:
- Cash and cash equivalents
- Accounts receivable, net
- Other current assets
- Equipment
- Other assets
For liabilities, possible categories include:
- Trade accounts payable
- Accrued expenses
- Other accounts payable
- Deferred revenue
- Employee payroll accrual
And within equity, you might use capital stock or ordinary shares, additional paid-in capital, and accumulated deficit. The exact categories depend on the company. The important point is that there should be a deliberate mapping from the detailed accounting records to the final financial statement.
Step 3: Simplify the Financial Statement Presentation
Once the mapping is complete, you can start building the final balance sheet. This is where you move away from the accounting-system mentality. You are no longer asking, What accounts do we have? Instead, you are asking, How should these balances be presented to someone reading the financial statements? Those are two very different questions.
Think in Financial Statement Categories
A messy balance sheet may list separate checking accounts, prepaid insurance, prepaid software, computer equipment, office equipment, multiple payable accounts, payroll liabilities, deferred revenue, common stock, APIC, and retained earnings as individual lines. There may be nothing technically wrong with having those accounts in the general ledger, but presenting every one individually can make the statement unnecessarily difficult to read.
A cleaner presentation might look like this:
Assets
- Cash and cash equivalents
- Accounts receivable, net
- Other current assets
- Equipment
- Other assets
Liabilities
- Trade accounts payable
- Accrued expenses
- Other accounts payable
- Deferred revenue
- Employee payroll accrual
Equity
- Capital stock
- Additional paid-in capital
- Accumulated deficit
Now somebody looking at the balance sheet can understand the company’s financial position without having to decode the chart of accounts.
Step 4: Build and Validate the Final Balance Sheet
At this point, the numbers should flow from the original report through the mapping into the final presentation. The final balance sheet should have a clear hierarchy: current assets, noncurrent assets, current liabilities, noncurrent liabilities where applicable, and equity, with appropriate subtotals.
And, of course, Total Assets = Total Liabilities + Equity. That equation sounds elementary, but when you are reorganizing and mapping dozens of accounts, it is an important control. If your original balance sheet balances but your final balance sheet does not, something probably went wrong in the mapping.
Mapping Is Also a Control
One reason I prefer using a separate mapping table is that it creates another control over the reporting process. Every balance sheet account should be mapped somewhere.
Ideally, you should be able to test for:
- Unmapped accounts
- Duplicate mappings
- Accounts accidentally omitted from the final statement
- Mapping changes from one reporting period to another
- Final totals that no longer agree with the source report
This turns the process into something repeatable. Next month, you do not rebuild the balance sheet from scratch. You update the source information, review any new accounts, and allow the existing mapping structure to produce the report.
Do Not Confuse Clean Presentation With Audit Readiness
Making a balance sheet look professional does not, by itself, make the underlying accounting audit-ready. The balances still need to be correct and supported.
- Cash should agree to the bank reconciliations.
- Accounts receivable should agree to the underlying receivables detail.
- Fixed assets should agree to the fixed-asset schedule.
- Accounts payable should reconcile to the AP subledger where applicable.
- Accruals should have supporting calculations.
- Deferred revenue should have supporting schedules.
- Equity should be supported by the appropriate corporate records and accounting activity.
Think of this cleanup process as one part of audit readiness. You need both good accounting underneath the financial statements and good presentation on the financial statements. One cannot substitute for the other.
What Makes a Balance Sheet Look Professional?
The best balance sheets are not necessarily the ones with the most information. Usually, they are the ones that present the right amount of information.
- Easy to read: Someone should be able to understand the major components without knowing your internal chart of accounts.
- Consistent: Account classifications and presentation should not change randomly from month to month.
- Traceable: Every financial statement number should ultimately connect back to the accounting records.
- Properly classified: Assets and liabilities should be grouped appropriately, including current versus noncurrent classifications where relevant.
- Balanced: Assets must equal liabilities plus equity.
Perhaps most importantly, the financial statement should tell the financial story of the company—not the story of how the accounting software happens to be configured.
The Bigger Lesson: Separate Accounting Detail From Reporting
A lot of accounting teams make the mistake of trying to make one chart of accounts serve every possible reporting purpose. Management wants one view. Auditors may want another. The CFO may want a condensed financial statement. Department heads may want additional detail. The general ledger still needs enough granularity to properly record transactions.
Instead of constantly redesigning the chart of accounts, a mapping layer allows you to maintain accounting detail while producing different reporting views. You are taking raw accounting data and turning it into useful financial information—and that is a big part of what higher-level accounting work is really about.
Final Takeaway
Turning a messy balance sheet into a professional financial statement does not require changing all of the underlying accounting. A practical process is:
- Preserve the original balance sheet.
- Map every detailed account to a financial statement category.
- Consolidate the accounts into a clean presentation.
- Build and validate the final balance sheet.
The general ledger can stay detailed. The financial statement should not be unnecessarily complicated. Once you build the mapping correctly, the process becomes much easier to repeat every month.
Join the Controller Academy
If you want to develop more of the practical skills accountants use beyond textbook accounting—including month-end close, financial statement preparation, reconciliations, reporting, and the day-to-day responsibilities of a financial controller—explore the Controller Academy. The program is designed to help accounting professionals build the practical skills used on the job.